Score
This new website is like Spotify Wrapped for your tax dollars
The launch of Tax Wrapped illustrates how innovative digital tools can enhance public understanding of complex financial systems, transforming abstract concepts into relatable insights. For brand strategy, this emphasizes the importance of creating engaging, user-friendly experiences that not only inform but also resonate with audiences on a personal level, potentially increasing brand loyalty and advocacy.
FastCompany: It’s April again, and that means hundreds of millions of Americans have been logging on to H&R Block or heading to their accountant to see how much they owe in taxes for 2025. For many who file, that dreaded number can feel like a nebulous sum. So how does the federal government use that hard-earned cash? There’s a website breaks it down for you, Spotify Wrapped-style.
Tax Wrapped is the latest digital project from Riley Walz , the technologist responsible for viral websites including Find My Parking Cops , a tool to track San Francisco’s parking authorities; Looksmapping , a map that ranks restaurants based on the “hotness” of their patrons; and, most recently, the JSuite , a series of tools designed to help users navigate the Epstein files . Walz’s projects almost always combine a trendy, eye-catching format with an underlying thread of social commentary, and Tax Wrapped is no different.
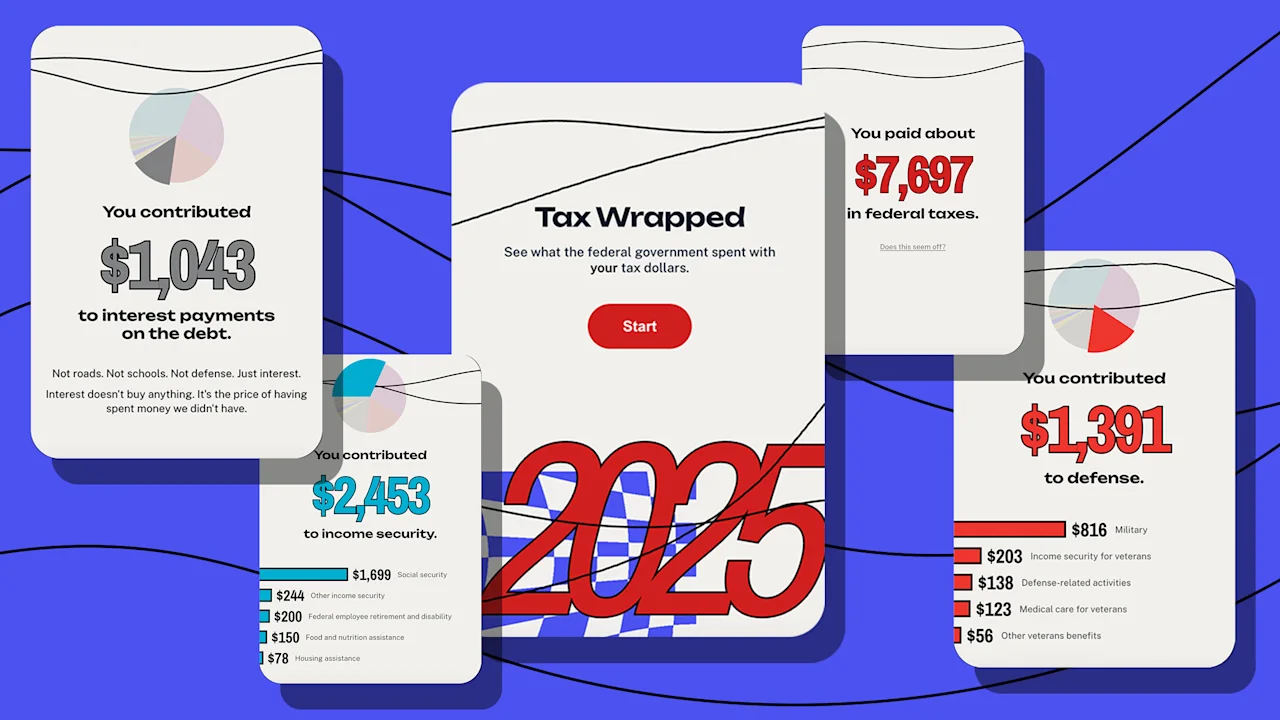
It remixes the Wrapped format—which is so popular that it’s become ubiquitous across brands such as Uber Eats, YouTube, Snapchat, and even LinkedIn—with a genuine lesson in financial literacy. [Screenshot: Tax Wrapped] How to use Tax Wrapped When users open Tax Wrapped, they’re greeted with a welcome screen that’s clearly taking a page out of 2025’s Spotify Wrapped design —this time rendered in red, white, and blue rather than a mix of neons. The tool requires a few details to calibrate: the user’s total taxable income, filing status, number of dependents, and work status.
From there, it makes an educated calculation on how much the user owed in taxes in 2025, which can be manually edited to the exact sum if needed. Walz broke down your contribution to the federal goverment’s annual spending using a few different touchpoints, according to the website’s methodology section. He derived the government’s top-line spending totals from the U.S.
Treasury’s monthly treasury statement , which Walz writes is “the standard source for deficit math and official category totals.” For more granular budgetary breakdowns, he pulled data from USAspending ’s File A accounts-balance data, which helped him split larger categories, like income security, into smaller subcategories, like Social Security and housing assistance. The data appears in both bar chart and pie chart form to help users digest it visually. By hovering over a given category, users can read a short description of what each subheading means and how it’s calculated.
[Screenshot: Tax Wrapped] An American who made $50,000 in 2025, for example, can see that they contributed $95 to natural resources, $2,124 to health, and $1,391 to the military (just $123 of which went to medical care for veterans). They can also dive deeper into how the federal government used taxes to pay off national debt—which, as the tool explains, has been racking up since 2001 and currently sits at more than $39 trillion. “The catch?” it reads.
Article truncated for readability. Read the full piece →
The article discusses an innovative tool that enhances public understanding of financial systems, which is significant for brand strategy professionals looking to create engaging user experiences, though the concept of using relatable insights is not entirely new.